|
Two Charts that Suggest the Housing Marketing Could Near a Repeat of 2007 by Tony Martinez

Tony Martinez is the Founder and Chairman of the US Tax Lien Association, which is an organization that is committed and dedicated to helping others achieve total financial freedom through the power of investing in Tax Lien Certificates. With over 30 years of expert experience, Tony is the world's #1 authority on the subject of creating enduring wealth through the little know strategy of investing in Tax Lien Certificates, which gives anyone the opportunity to earn guaranteed fixed rates of returns of 18% – 36% interest per year, and acquire valuable real estate for approximately 10% of market value.
The housing market continues to climb as low inventories and high building costs push prices higher. However, the end of the foreclosure moratorium is helping to increase housing inventories and is providing much needed supply for homebuyers. Additionally, building costs are dropping as supply lines reopen and harvesting and manufacturing are returning to normal levels. However, housing prices continue to rise even without the inflationary pressures. The FRED (Federal Reserve Economic Data) shows the inflationary adjusted S&P/Case-Shiller U.S. Home Price Index has now topped 2007 highs. This could suggest that the housing market is in another inflated bubble. The fact that the chart adjusts for inflation is important because it helps to account for the rising construction costs and suggests that prices are moving more upon speculation and not just consumer demand.  S&P/Case-Shiller U.S. National Home Price Index/Consumer Price Index for All Urban Consumers: All Items in U.S. City Average*100 A recent consumer survey found that many consumers view today’s conditions as a bad time to buy a house. Consumers may feel this way because they’re feeling nearly the same income pinch that they felt in 2007. The Home Price to Median Household Income Ratio (US) is near it’s 2006-2007 highs. It’s no wonder that consumers feel it’s a bad time to buy homes because it’s too much for their budgets to handle. With the cost of housing taking so much out of the consumer budget, the time may come when something has to give.  Home Price/Median Income Ratio from January 2000 to April 2021 If and when the housing bubble pops, this could mean a higher likelihood of tax defaults and a higher likelihood that tax lien investors being granted homes by the tax collectors. Additionally, tax deed investors may find greater auction inventories which could mean less competitions and lower prices on tax deed homes. While no one rejoices over someone’s budget being busted and losing a home, states and municipalities still need to the funds to operate and offer essential services. They’ll lean heavily on the relief provided by lien and deed investors.
Sincerely,
TLC Amount: $118.15
Pays You: 15% Interest / Year
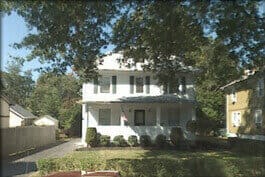
645 Church St, Bound Brook, NJ
Size:
2683 sq. ft.
Lot:
14,810 sq. ft.
Bedrooms:
4
Bathrooms:
2
Assessed Value:
$484,700
Market Value:
$419,700
|
